Technical Note 14 – Best Practice for Protein Quantifications and Antibody Quantifications
Protein concentrations are frequently used in life science research. Although there are several assays available, care should be taken to select the optimum assay or method for the particular sample type. The decision on which assay or method to use is typically based on convenience, quantity and purity of protein available. In this technical note, we provide best practice advice for using the NanoPhotometer® to perform small volume protein quantification at 280 nm (Protein UV280) and also point to protein assays including Bradford, BCA, etc. for the indirect determination of the protein concentrations via a chemical binding reaction
Proteins have a characteristic absorption spectrum peak at 280 nm, predominantly from the aromatic amino acids phenylalanine, tyrosine, and tryptophan. The Beer-Lambert law can be applied to determine the protein concentration of a sample. This UV based approach depends strongly on the purity and primary sequence of a protein. Some components which are commonly present in protein samples show strong UV absorbance and should be corrected for or avoided altogether. Since the NanoPhotometer® is scanning every sample from 200 – 900 nm, dye labels absorbing in the visible range can be detected simultaneously to calculate the dye concentration as well as the degree of labeling.
The NanoPhotometer® has a unique Blank Control™ feature that will automatically warn the user if high background is present in a blank from buffers or contaminants (see Technical Note #3 Blank Control™ and Appendix 1). For protein lysates containing agents blocking the entire UV range, e.g. RIPA buffer, protein UV280 is not available. If these buffers cannot be replaced with non-interfering agents, indirect determination utilizing a protein assay is mandatory (please refer to our Protein Assay Technical Note for further information). If these buffers cannot be replaced with non-interfering agents, indirect determination utilizing a protein assay is mandatory.
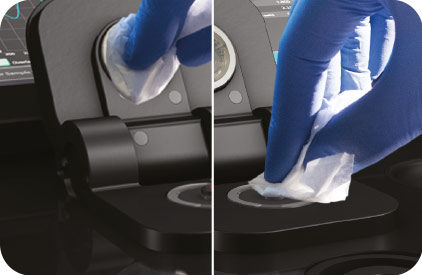
Figure 1: The pedestal and mirror are being cleaned with a lint-free tissue
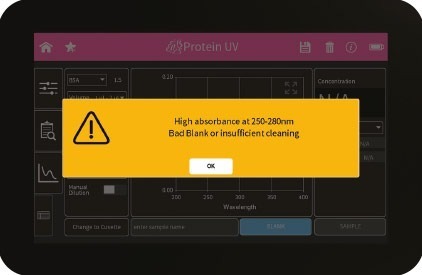
Figure 2: Bad Blank warning.
Protein Quantification and Antibody Quantification Steps
To obtain optimal readings we suggest the following steps:
- Protein samples tend to stick. Clean the measurement head (both bottom and top/mirror) using a water dampened, lint free tissue (avoid vigorous polishing to prevent lint deposits on the quartz window) and apply a drying step with a fresh tissue after a wet wipe.
- If the pedestal is severely dirty, apply 5 µl of water onto the pedestal to soak the spot for at least one minute and wipe the pedestal and mirror thoroughly afterwards.
- Blank with the same buffer solution used to elute/dissolve the sample.
- Avoid to use the following buffers or reagents that show similar characteristics like the following:
RIPA
NDSB
- To check on whether a buffer is interfering, run a water blank and then check your intended buffer and/or reagents as a sample using a full wavelength scan.
- If you see peaks in the area of interest or even a concentration displayed, replace the components with alternatives not showing the interference.
- Control the pH value and ionic strength of your sample. Changes of the pH and/or ionic strength can lead to a change in the absorbance spectrum of your sample and to incorrect concentration and purity calculations.
- Use low-binding tubes for samples with low concentrations.
- Measure the blanking solution as a sample to identify a bad blank.
- Homogenize the sample using the integrated vortex or by pipetting up/down.
- Use illuminated pedestal do identify if sample is well positioned and no bubbles are visible.
- Activate “Air Bubble Recognition” if using buffers containing detergents like Tween or Triton.
- Use the reverse pipetting technique when applying the sample onto the measurement head to avoid air bubbles.
- Measure replicates if sample concentration is <0.1 mg/ml, expect greater % errors.
- Check the 260/280 ratio and graph data for contaminants. Sample Control will flag bad samples.
- Properly clean pedestal after each use.
Protein Quantification and Antibody Quantification Important Warning Messages:
| Message Text | Explanation/Solution |
| Air bubble, lint residue or bad sample. Please reapply sample. | Air bubble recognition is on and has detected either an air bubble, lint residue or a bad sample like e.g. a turbid sample. Check sample, clean the sample window on pedestal and mirror in the lid arm thoroughly and reapply sample carefully. To avoid air bubbles apply sample by reverse pipetting. |
| High absorbance at 250 – 280 nm, 280 – 340 nm, 340 – 400 nm, 400 – 475 nm, 475 – 550 nm, 550 – 625 nm, 625 – 700 nm. Bad Blank or insufficient cleaning. | The warning message is shown when a blank measurement (NanoVolume) detects a significant absorbance a potential area of interest. The warning message shows the wavelength range where the absorbance is appearing. Two things can cause high absorbance in a blank measurement: either the blank solution/buffer has an absorbance in this wavelength range or the sample window on pedestal and the mirror in the lid arm was not cleaned properly after the last reading. Clean the sample window on pedestal and the mirror in the lid arm thoroughly and check the blank solution for absorbance (Use water for blank and measure the blank buffer as sample). |
| Lint residue or bad sample. Please reapply sample. | Displayed when Air Bubble Recognition is off. Software has detected either a lint residue or a bad sample like e.g. a turbid sample. Check sample, clean the sample window on pedestal and mirror in the lid arm thoroughly and reapply sample carefully. |
| Maximum absorbance level at specified wavelength reached. Calculations may lead to low/wrong results. | The concentration of the sample used is too high and exceeds the specified absorbance range. Maximum absorbance is 330 A (10 mm path) for NanoVolume and 2.65 A for cuvette measurements. Dilute sample and measure again. |
| Maximum level exceeded. | This message is shown when for example, too many dyes or wavelength are added with the Add + button. It is possible to add up to 20 dyes or wavelengths. |
| Sample concentration too low for 0.3 µl – change volume and parameter settings to 1 µl | The measurement parameters for 0.3 µl NanoVolume samples read only the 0.07 mm path length (dilution 140). The utilized sample concentration is too low. Please use 1 µl of the sample and change the volume setting to 1 – 2 µl. Minimum concentrations for the 0.07 mm path length for dsDNA 420 ng/µl and for BSA 12.6 mg/ml |
For further questions or if assistance is needed, please contact your local Implen Support Team at [email protected] or [email protected].