Technical Note 9 – Bradford Assay in Microvolume
Material
Assay Protocol For NanoVolume Measurements
Parameter Settings in
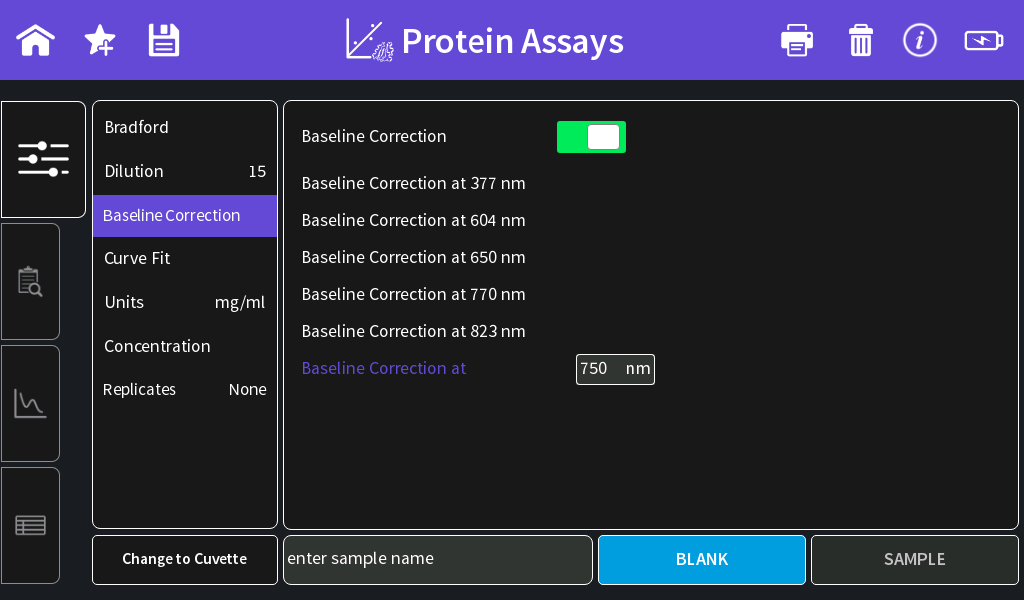
Protein Assay Method:
- Bradford (595 nm)
- Dilution 15/0.67 mm path
- Baseline correction:
NanoPhotometer® NP80/N60 to 750 nm
NanoPhotometer® N50 to 350 nm - Curve Fit: Regression 2nd order
- Units: Depends on the standards used
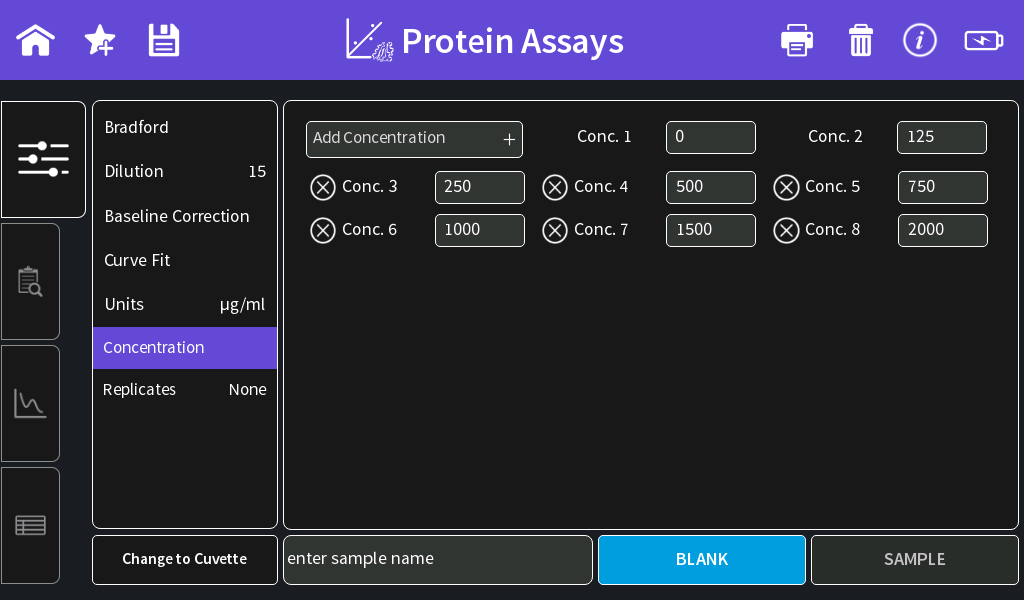
- Concentration:
Enter the concentrations of the used standards. Concentrations can be added by clicking on the “Add Concentration” button.
Pre-diluted BSA standards of Thermo Scientific: 0 µg/ml; 125 µg/ml;
250 µg/ml; 500 µg/ml; 750 µg/ml; 1000 µg/ml; 1500 µg/ml and 2000 µg/ml. - Replicates: Three replicates recommended
Create Standard Curve:
- Use 2 µl of ddH2O for the Blank measurement
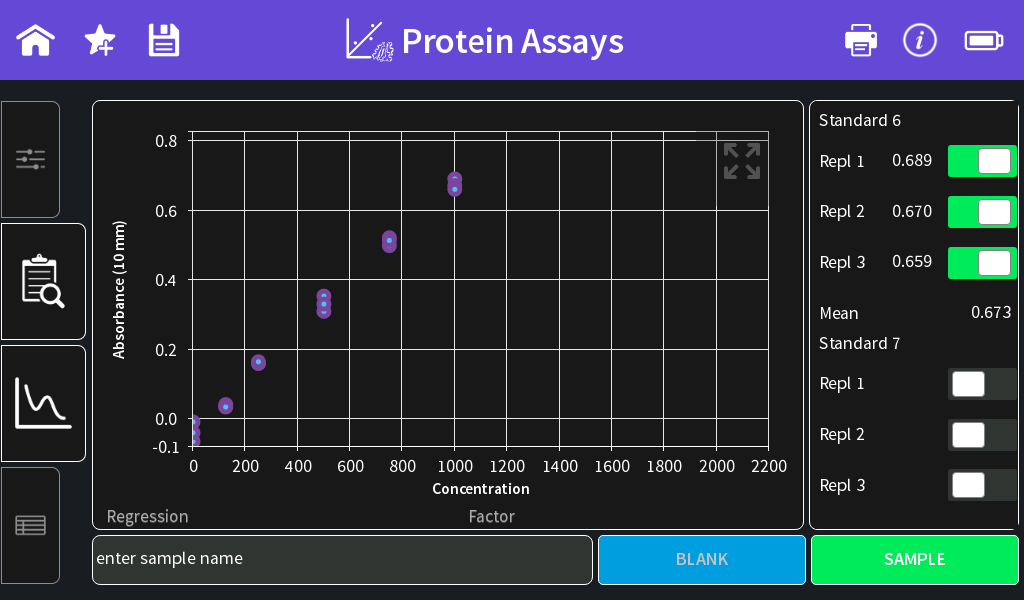
- Measure 2µl of each standard/standard replicate step by step
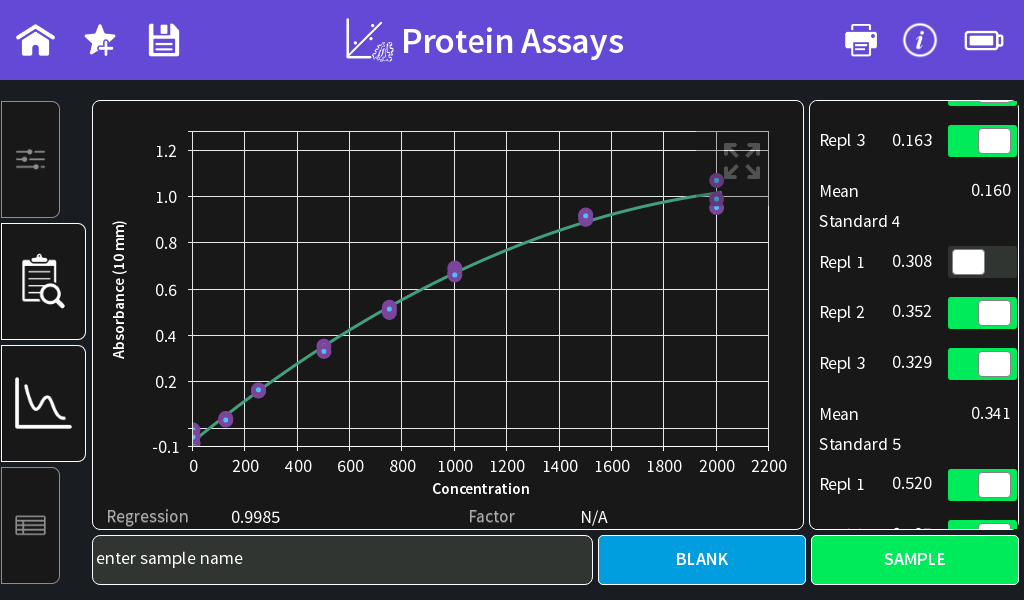
- Once all standards are measured, the standard curve is shown and the Regression is calculated. It is possible to exclude single standard or replicate measurements from the standard curve calculation by switching the toggle switch off.
Measure Unknown Samples:
Use 2 µl sample volume for measurements of unknown samples. Concentration will be shown in the results and table view.
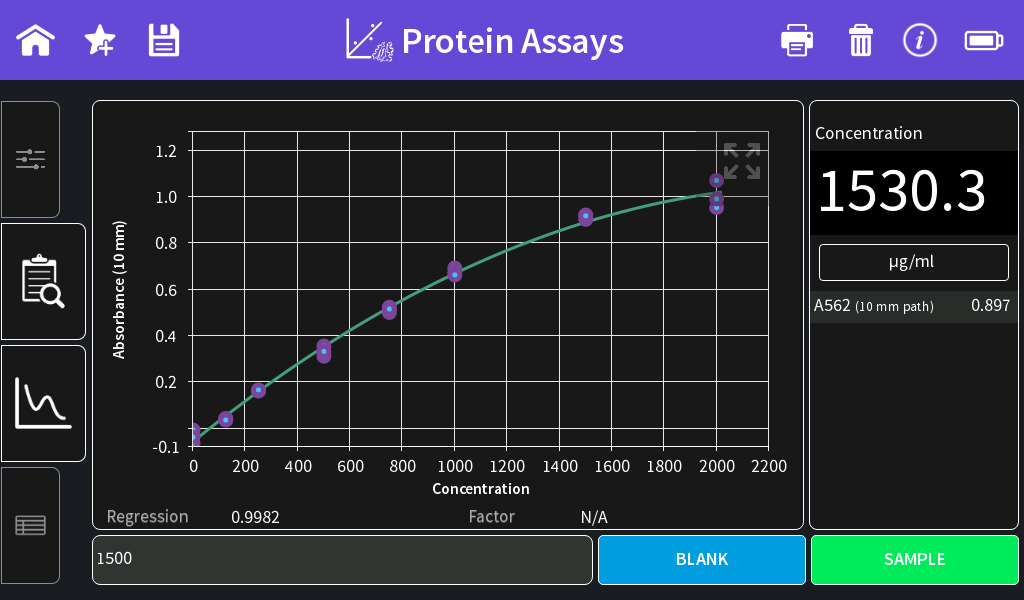
Results
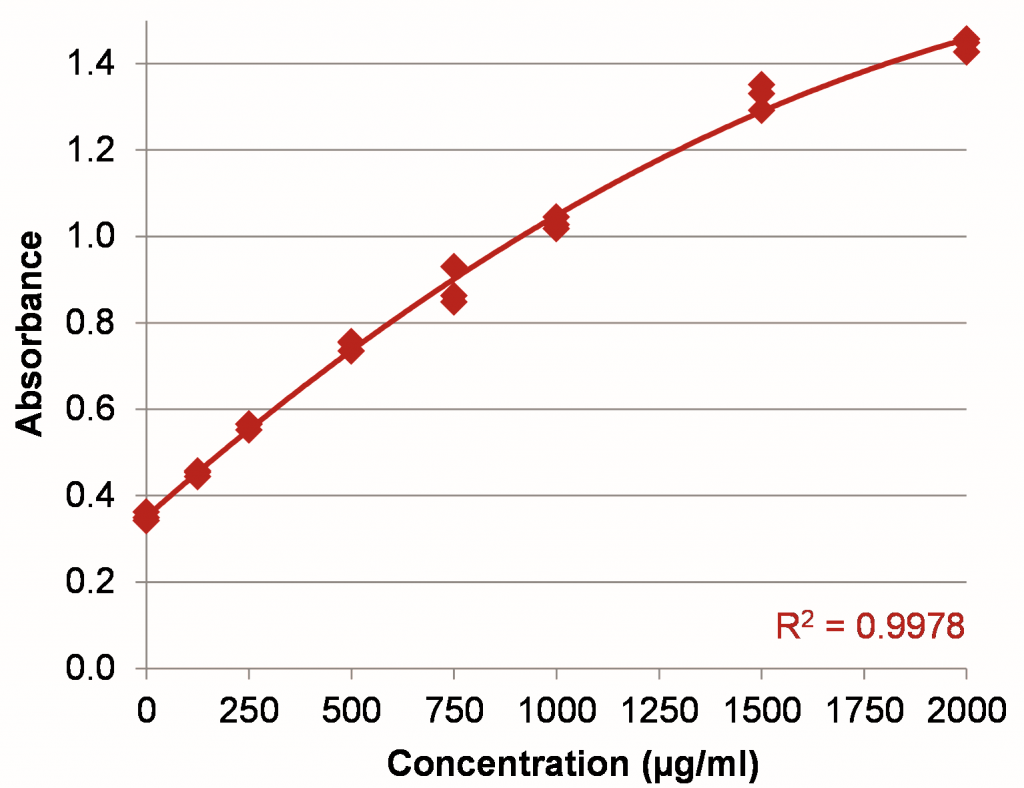
Figure 1: BSA standard curve in the range of 0–2000 µg/ml using a 50:1 sample to assay reagent ratio.
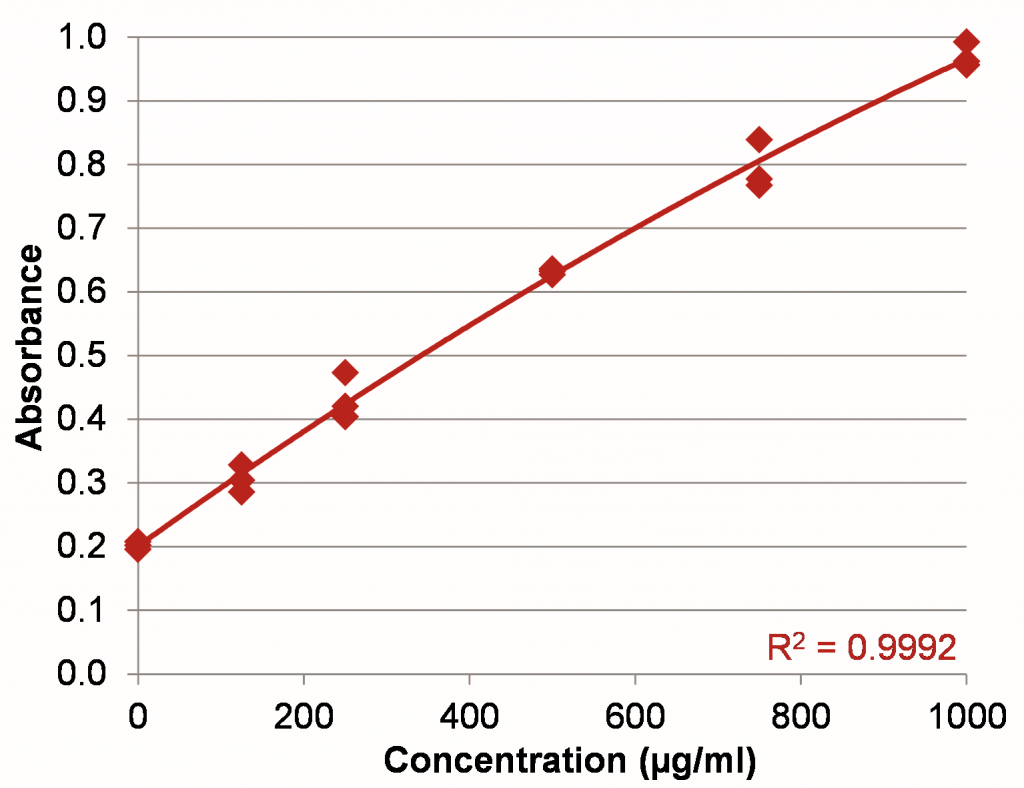
Figure 2: BSA standard curve in the range of 0–1000 µg/ml using a 50:1 sample to assay reagent ratio.
References
Bradford, M. M. (1976). A rapid and sensitive method for the quantitation of microgram quantities of protein utilizing the principle of protein-dye binding. Analyt. Biochem.
72, 248–254.
Compton, S. J. and Jones, C. G. (1985). Mechanism of dye response and interference in the Bradford protein assay. Analyt. Biochem. 151, 369–374.
Kruger N.J. (2002). The Bradford Method for Protein Quantitation. In: Walker J.M. (eds) The Protein Protocols Handbook. Humana Press